


Infographics
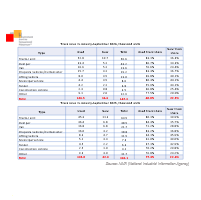
Which segments grew in a declining truck market?
According to the marketing agency NAPI, 183.1 thousand trucks* were sold in January-September 2026, representing a 2.3% decline on the similar period of 2025. Of them, 36.6 thousand units were new (-13.7% year-over-year), while 146.5 thousand units were used (+1.1%).
Within the new truck market, the sharpest sales decline was shown by the following segments: lifting vehicles (-25.5%), construction vehicles (-24.5%), vans (-25.4%), and dumpers (-24.4%). The only segment to achieve growth was...
More ...
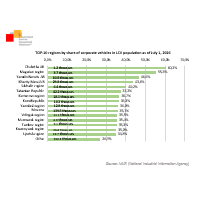
Regions with predominant number of LCV owned by corporate clients
According to the marketing agency NAPI, as of July 1, 2026, the LCV* population numbered 4.5 million vehicles. Of them 1.3 million LCV belong to corporate clients.
Vehicles owned by corporate clients account for 29.0% of the population. This share is higher in 48 Russian regions.
More than half of LCV belong to corporate clients in the Chukotka AR and the Magadan region, more than 40% - in the Yamalo-Nents AR, Khanty-Mansi AR and the Sakhalin region.
*vehicles with GVW...
More ...
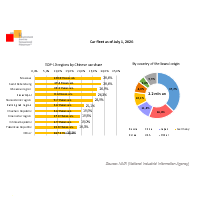
What regions have the larger Chinese car fleets
According to the marketing agency NAPI, the car fleet numbers 2.2 million units as of July 1, 2026.
Russian brands dominate the fleet with 830.4 thousand units, accounting for 37.2%. Chinese cars rank second in the fleet with 415.7 thousand units: their share reached 18.6%. Japanese and German cars account for 11.4% (253.7 thousand units) and 10.1% (225.3 thousand units) of the fleet, respectively.
Smaller shares belong to Korean brands - 8.0% (179.3 thousand units), American brands -...
More ...
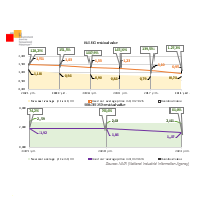
Residual value of KIA Rio and Belgee X50 cars
The marketing agency NAPI has updated its "Car residual value" report based on Q III 2026 data. The chart shows average prices for new KIA Rio (of 2019–2021 years of manufacture) and Belgee X50 (of 2023–2025 years of manufacture) cars, as well as the residual value of used versions of these cars in Q III of the current year.
KIA Rio models manufactured in 2016 retained 127.3% of their original average price. The residual value of models manufactured in 2017 was 139.5%. Models...
More ...
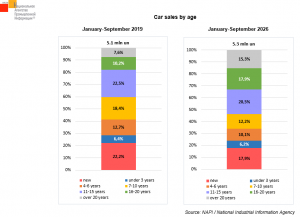
The number of cars sold over 9 months of 2026 exceeded that in 2019
The marketing agency NAPI compared car sales in the pre-crisis 2019 and the current 2026.
In January-September 2026, car sales made 5.3 million units, which was a 4.8% rise on 2019. Sales of new cars fell by 15.6% (950.2 thousand units), while those of used ones grew by 10.6% (4.4 million units).
Sales over a 7-year period grew primarily due the oldest used cars: aged 16-20 years (+83.4% to 949.1 thousand units) and over 20 years (+111.0% to 811.5 thousand units). Slight growth was shown...
More ...
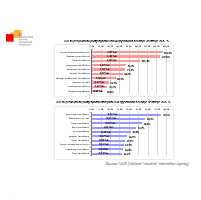
New truck sales increased in 23 regions
According to the marketing agency NAPI, 36.6 thousand new and 146.4 thousand used trucks* were sold in January-September 2026.
New truck sales fell by 13.7% year-on-year. Despite the overall sales decline, positive dynamics in truck sales took place in 23 regions. Sales more than doubled in the Chukotka Autonomous Region, as well as the Vladimir and Tver regions.
Used truck sales grew by 1.0% year-on-year. Growth in truck sales was shown by 52 regions. Sales increased by more than a...
More ...
Other research
 Corporate vehicle fleet
  Corporate vehicle market
 Market analysis
 Spare parts market analysis
 Automotive statistics
 Automotive leasing
 IT-solutions for automotive market analysis
 Taxi population in Russia
 Dealers
 Financial capacity of the automotive market
 Corporate vehicle market
 Total cost of ownership
 Special purpose vehicle
 Legal factors affecting automotive market formation
 Vehicle prices
 Residual value of cars and special purpose vehicles
 Forecasts