10.10.2022 / 354.7 billion rubles were spent on the purchase of new and used lcv
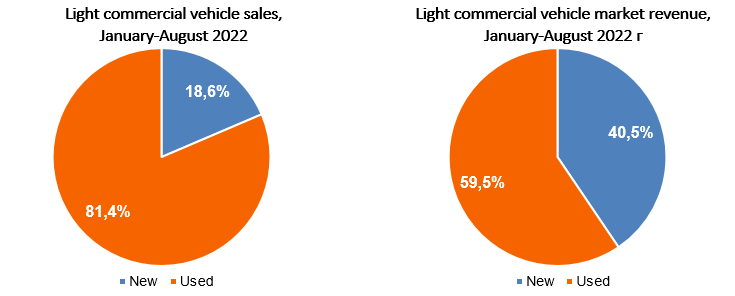
According to the Marketing Agency NAPI (National Industrial Information Agency), 354.7 billion rubles were spent on the purchase of new and used light commercial vehicles over eight months of 2022. It should be noted that new light commercial vehicles accounted for slightly more than 40% of this amount, while the share of new vehicles in the sales structure "in quantitative terms" was only 18.6%.
In terms of financial indicators, GAZ is the leader in the new and used vehicle market due to large sales volumes.
New and used light commercial vehicle market revenue, January-August 2022
| Sales, units |
Weighted average price, rubles | Market revenue, million rubes |
|
| New vehicles | 55 177 | 2 605 437 | 143 760 |
| Used vehicles | 241 756 | 872 428 | 210 915 |
| Total | 296 933 | - | 354 675 |
Source: NAPI (National Industrial Information Agency)
Source: NAPI (National Industrial Information Agency)
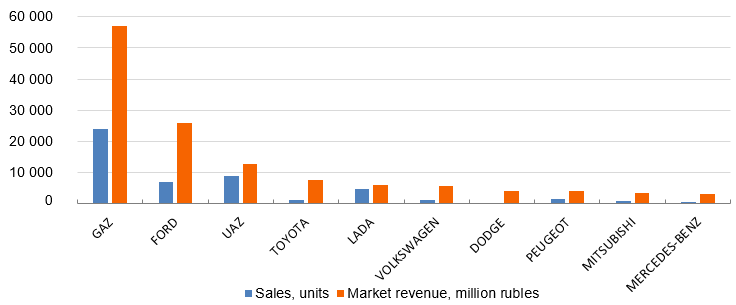
New light commercial vehicle market revenue, ТОР-10 brands, January-August 2022
| Brand | Sales, thousand units |
Weighted average price, rubles | Market revenue, million rubes |
| GAZ | 24 077 | 2 365 551 | 56 955 |
| FORD | 7 066 | 3 691 764 | 26 086 |
| UAZ | 8 930 | 1 416 601 | 12 650 |
| TOYOTA | 1 346 | 5 738 846 | 7 724 |
| LADA | 4 877 | 1 246 133 | 6 077 |
| VOLKSWAGEN | 1 310 | 4 347 711 | 5 696 |
| DODGE | 404 | 10 530 450 | 4 254 |
| PEUGEOT | 1 416 | 2 927 197 | 4 145 |
| MITSUBISHI | 790 | 4 604 267 | 3 637 |
| MERCEDES-BENZ | 555 | 5 443 943 | 3 021 |
Source: NAPI (National Industrial Information Agency)
Sales and market revenue, 2022 (January-August)
Source: NAPI (National Industrial Information Agency)
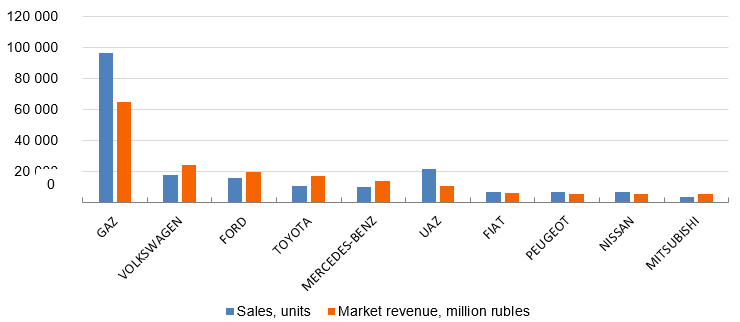
Used light commercial vehicle market revenue, ТОР-10 brands, January-August 2022
| Brand | Sales, thousand units |
Weighted average price, rubles | Market revenue, million rubes |
| GAZ | 96 597 | 668 602 | 64 585 |
| VOLKSWAGEN | 17 591 | 1 389 663 | 24 446 |
| FORD | 16 031 | 1 230 356 | 19 724 |
| TOYOTA | 10 854 | 1 603 769 | 17 407 |
| MERCEDES-BENZ | 10 002 | 1 378 444 | 13 787 |
| UAZ | 21 713 | 500 868 | 10 875 |
| FIAT | 6 586 | 909 401 | 5 989 |
| PEUGEOT | 6 677 | 864 411 | 5 772 |
| NISSAN | 6 815 | 838 066 | 5 711 |
| MITSUBISHI | 3 811 | 1 358 109 | 5 176 |
Source: NAPI (National Industrial Information Agency)
Sales and market revenue, 2022 (January-August)
Source: NAPI (National Industrial Information Agency)


