04.10.2022 / 3.7 trillion rubles were spent on the purchase of new and used cars
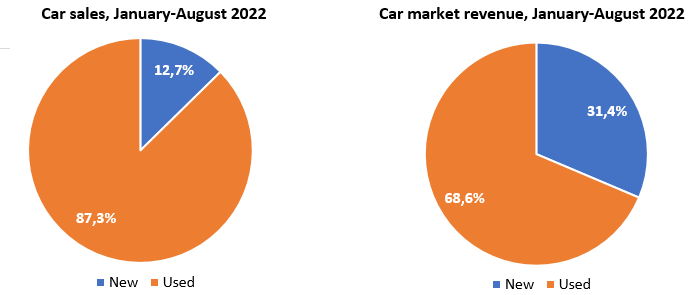
According to the Marketing Agency NAPI (National Industrial Information Agency), 3.7 trillion rubles were spent on the purchase of new and used cars over eight months of 2022. New cars accounted for slightly less than a third of this amount.
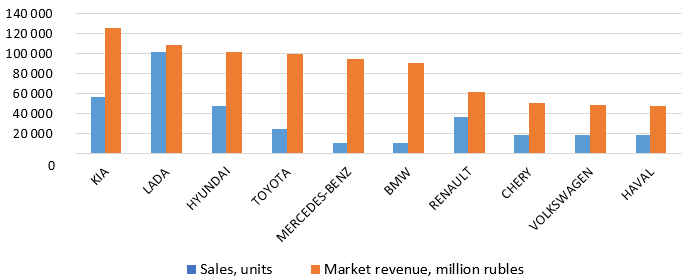
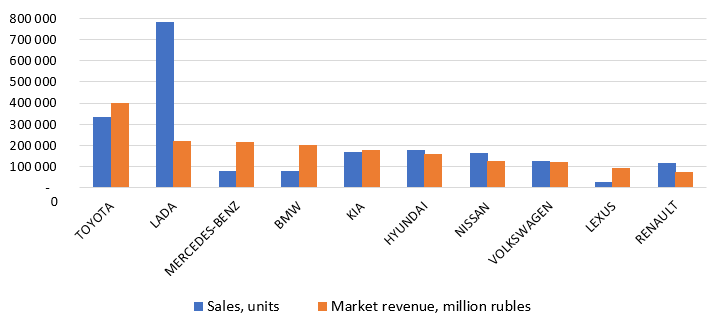
KIA is the leader in the new car market by financial results: 125.5 billion rubles were spent on the purchase of its cars. TOYOTA is the leader in the used car market by financial results: car owners spent three times more money on the purchase of cars of this brand - 398.2 billion rubles.
New and used car market revenue, January-August 2022
| Sales, thousand units | Weighted average price, rubles |
Market revenue, million rubles |
|
| New cars | 447.8 | 2 641 662 | 1 182 838 |
| Used cars | 3 090.5 | 1 194 437 | 2 587 442 |
| Total | 3 538.3 | - | 3 770 280 |
Source: NAPI (National Industrial Information Agency)
Source: NAPI (National Industrial Information Agency)
New car market revenue, ТОР-10 brands, January-August 2022
| Brand | Sales, units | Weighted average price, rubles | Market revenue, million rubles |
| KIA | 56 685 | 2 213 362 | 125 464 |
| LADA | 101 704 | 1 071 118 | 108 937 |
| HYUNDAI | 47 169 | 2 144 157 | 101 138 |
| TOYOTA | 24 693 | 4 043 963 | 99 858 |
| MERCEDES-BENZ | 10 087 | 9 416 990 | 94 989 |
| BMW | 10 507 | 8 570 367 | 90 049 |
| RENAULT | 36 642 | 1 678 760 | 61 513 |
| CHERY | 18 691 | 2 691 940 | 50 315 |
| VOLKSWAGEN | 18 150 | 2 645 403 | 48 014 |
| HAVAL | 18 114 | 2 616 798 | 47 401 |
Source: NAPI (National Industrial Information Agency)
Sales and market revenue, 2022 (January-August)
Source: NAPI (National Industrial Information Agency)
Used car market revenue, ТОР-10 brands, January-August 2022
| Brand | Sales, units | Weighted average price, rubles | Market revenue, million rubles |
| TOYOTA | 335 330 | 1 187 553 | 398 222 |
| LADA | 781 855 | 284 756 | 222 638 |
| MERCEDES-BENZ | 80 512 | 2 687 879 | 216 407 |
| BMW | 77 767 | 2 588 741 | 201 319 |
| KIA | 167 567 | 1 077 945 | 180 628 |
| HYUNDAI | 176 635 | 908 041 | 160 392 |
| NISSAN | 162 728 | 766 570 | 124 742 |
| VOLKSWAGEN | 124 788 | 960 497 | 119 859 |
| LEXUS | 29 453 | 3 117 156 | 91 810 |
| RENAULT | 116 372 | 648 834 | 75 506 |
Source: NAPI (National Industrial Information Agency)
Sales and market revenue, 2022 (January-August)
Source: NAPI (National Industrial Information Agency)


