24.01.2020 / Demand for new trailers decreased by 3% in 2019
Download In 2019 the market of new trailers and semi-trailers1 showed negative dynamics (-2.6% on 2018) and amounted to 32.34 thousand units.
In 2019 the market leader SCHMITZ sold 4.44 thousand trailers, which was a 8.3% rise on 2018. The second place belongs to TONAR: sales of trailers of this brand increased by 22.3%. It is followed by NEFAZ, trailer sales of which remained at the level of 2018.
The largest regional markets in 2019 were the Moscow region, Tatarstan Republic and Moscow.
The most significant growth of demand for trailers among TOP-20 regional markets was shown by the Nizhny Novgorod region: +29.2%, while the sharpest decline in new trailer sales - by Tatarstan Republic: -22.1%.
New trailer sales, ТОР-10 brands,
January-December 2019/2018, thousand units
|
Brand |
January-December 2018 |
January-December 2019 |
Change, % |
|---|---|---|---|
|
SCHMITZ |
4.10 |
4.44 |
8.3 |
|
TONAR |
2.33 |
2.85 |
22.3 |
|
NEFAZ |
2.52 |
2.52 |
0.0 |
|
KRONE |
3.49 |
2.35 |
-32.7 |
|
KAESSBOHRER |
1.17 |
1.59 |
35.9 |
|
KOEGEL |
1.67 |
1.22 |
-26.9 |
|
WIELTON |
1.00 |
1.03 |
3.0 |
|
SESPEL |
1.08 |
1.00 |
-7.4 |
|
GRUNWALD |
0.94 |
0.83 |
-11.7 |
|
TSP |
0.61 |
0.66 |
8.2 |
|
ТОР-10 |
18.91 |
18.49 |
-2.2 |
|
Other |
14.29 |
13.85 |
-3.1 |
|
Total |
33.20 |
32.34 |
-2.6 |
Source: Russian Automotive Market Research
New trailer sales, ТОР-10 brands,
December 2019/2018, thousand units
|
Brand |
December 2018 |
December 2019 |
Change, % |
|
SCHMITZ |
0.50 |
0.54 |
8.0 |
|
KRONE |
0.37 |
0.32 |
-13.5 |
|
NEFAZ |
0.26 |
0.28 |
7.7 |
|
TONAR |
0.26 |
0.26 |
0.0 |
|
KAESSBOHRER |
0.10 |
0.16 |
60.0 |
|
KOEGEL |
0.16 |
0.14 |
-12.5 |
|
SESPEL |
0.18 |
0.12 |
-33.3 |
|
NOVTRUCK |
0.07 |
0.11 |
57.1 |
|
WIELTON |
0.11 |
0.11 |
0.0 |
|
NOVOSIBARZ |
0.11 |
0.10 |
-9.1 |
|
ТОР-10 |
2.12 |
2.14 |
0.9 |
|
Other |
1.73 |
1.66 |
-4.0 |
|
Total |
3.85 |
3.80 |
-1.3 |
Source: Russian Automotive Market Research
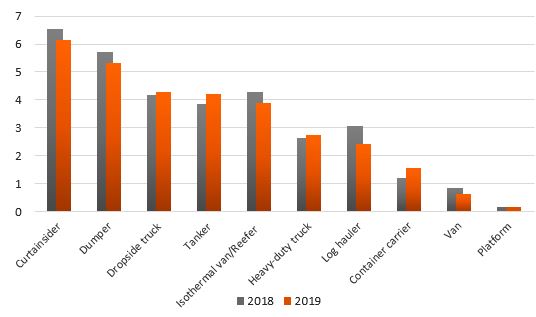
New trailer sales, ТОР-10 body types,
January-December 2019/2018, thousand units

Source: Russian Automotive Market Research
New trailer sales, ТОР-20 regions,
January-December 2019/2018, thousand units
|
Region |
January-December 2018 |
January-December 2019 |
Change, % |
|
Moscow region |
4.04 |
3.62 |
-10.4 |
|
Tatarstan Republic |
2.67 |
2.08 |
-22.1 |
|
Moscow |
2.14 |
1.84 |
-14.0 |
|
Saint Petersburg |
1.70 |
1.70 |
0.0 |
|
Smolensk region |
1.37 |
1.44 |
5.1 |
|
Nizhny Novgorod region |
1.06 |
1.37 |
29.2 |
|
Khanty-Mansi AR |
1.13 |
1.10 |
-2.7 |
|
Krasnodar region |
0.95 |
0.95 |
0.0 |
|
Rostov-on-Don region |
1.03 |
0.88 |
-14.6 |
|
Sverdlovsk region |
0.82 |
0.70 |
-14.6 |
|
Chelyabinsk region |
0.70 |
0.68 |
-2.9 |
|
Irkutsk region |
0.71 |
0.68 |
-4.2 |
|
Krasnoyarsk region |
0.70 |
0.68 |
-2.9 |
|
Stavropol region |
0.68 |
0.63 |
-7.4 |
|
Samara region |
0.63 |
0.57 |
-9.5 |
|
Voronezh region |
0.66 |
0.55 |
-16.7 |
|
Orenburg region |
0.42 |
0.53 |
26.2 |
|
Perm region |
0.39 |
0.48 |
23.1 |
|
Belgorod region |
0.48 |
0.45 |
-6.2 |
|
Bashkortostan Republic |
0.37 |
0.43 |
16.2 |
|
ТОР-20 |
22.65 |
21.36 |
-5.7 |
|
Other |
10.55 |
10.98 |
4.1 |
|
Total |
33.20 |
32.34 |
-2.6 |
Source: Russian Automotive Market Research
1 Hereinafter trailers

