26.03.2020 / BIG-7 vehicles account for half of the new truck market capacity
Download .
.
In January-February 2020 new truck sales in money terms amounted to 74.5 billion rubles (+20.8% year-on-year).
The weighted average price for new trucks grew by 11.2% on the same period of 2019 to 6 326 233 rubles.
New truck weighted average prices and market revenue,
January-February 2020/2019
|
Indicator |
2019 (January-February) |
2020 (January-February) |
Growth/loss, % |
|
Weighted average price, rubles |
5 687 513 |
6 326 233 |
11.2 |
|
Market capacity, million rubles |
61 670 |
74 517 |
20.8 |
Source: Russian Automotive Market Research
Over the first two months of 2020 trucks on 84.3 billion rubles were sold in the used vehicle market (+13.3% year-on-year).
The weighted average price for used trucks grew by 2.4% to 324 2 037 rubles.
Used truck weighted average prices and market revenue,
January-February 2020/2019
|
Indicator |
2019 (January-February) |
2020 (January-February) |
Growth/loss, % |
|
Weighted average price, rubles |
1 988 905 |
2 037 324 |
2.4 |
|
Market capacity, million rubles |
74 365 |
84 278 |
13.3 |
Source: Russian Automotive Market Research
New truck market
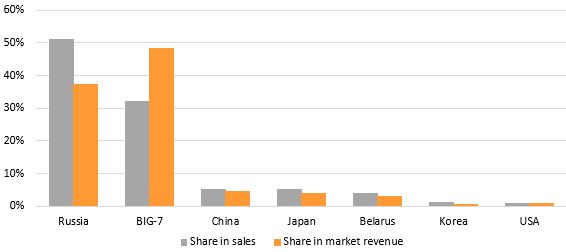
BIG-7 trucks1 accounted for almost half of the total market capacity in January-February 2020 – 36.2 billion rubles. 28.0 billion rubles were spent on the purchase of Russian trucks, which was 38% of the total market capacity.
New truck sales and market revenue,
by country of brand origin, January-February 2020
|
Dynamics, |
Sales, |
Country of brand origin |
Country of brand origin |
Market revenue, |
Dynamics, |
|
-2.2 |
6.04 |
Russia |
BIG-7 |
36 187 |
29.8 |
|
22.6 |
3.78 |
BIG-7 |
Russia |
28 000 |
5.5 |
|
84.6 |
0.61 |
China |
China |
3 553 |
103.3 |
|
26.6 |
0.61 |
Japan |
Japan |
3 005 |
36.3 |
|
-18.8 |
0.46 |
Belarus |
Belarus |
2 292 |
-7.3 |
|
-15.9 |
0.14 |
Korea |
USA |
837 |
695.9 |
|
578.9 |
0.13 |
USA |
Korea |
594 |
-0.2 |
|
-65.0 |
0.01 |
Other |
Other |
49 |
-62.6 |
|
8.6 |
11.78 |
Total |
Total |
74 517 |
20.8 |
Source: Russian Automotive Market Research
New truck sales and market revenue,
by country of brand origin, %

Source: Russian Automotive Market Research
The leader by financial results among regional markets became the Moscow region. Over the first two months of 2020 new trucks on 7.0 billion rubles were sold in the region. Capacity of the markets of Khanty-Mansi AR and Moscow, which are also included in TOP-3 by this indicator, amounted to 6.0 billion rubles and 5.1 billion rubles, respectively.
New truck sales and market revenue,
TOP-10 regions, January-February 2020
|
Dynamics, |
Sales, |
Region |
Region |
Market revenue, |
Dynamics, |
|
28.3 |
1.02 |
Moscow region |
Moscow region |
6 967 |
46.1 |
|
48.3 |
0.87 |
Khanty-Mansi AR |
Khanty-Mansi AR |
6 011 |
81.9 |
|
-3.5 |
0.85 |
Moscow |
Moscow |
5 085 |
0.7 |
|
22.1 |
0.56 |
Tatarstan Republic |
Tatarstan Republic |
3 350 |
33.0 |
|
9.6 |
0.39 |
Saint Petersburg |
Saint Petersburg |
2 822 |
25.9 |
|
10.7 |
0.35 |
Chelyabinsk region |
Chelyabinsk region |
1 953 |
37.4 |
|
-29.2 |
0.28 |
Nizhny Novgorod region |
Nizhny Novgorod region |
1 934 |
-9.8 |
|
-9.6 |
0.27 |
Krasnodar region |
Irkutsk region |
1 871 |
44.3 |
|
-9.1 |
0.27 |
Krasnoyarsk region |
Smolensk region |
1 759 |
-11.3 |
|
2.7 |
0.26 |
Bashkortostan Republic |
Krasnodar region |
1 757 |
15.2 |
Source: Russian Automotive Market Research
Used truck market
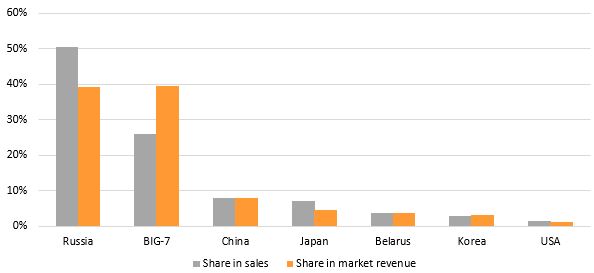
33.1 and 33.3 billion rubles were spent on the purchase of used trucks of Russian and BIG-7 brands, which was 39% of the used truck market capacity.
TOP-3 by market revenue also included Japanese brands, vehicles of which cost customers 6.6 billion rubles.
Used truck sales and market revenue,
by country of brand origin, January-February 2020
|
Dynamics, |
Sales, |
Country of brand origin |
Country of brand origin |
Market revenue, |
Dynamics, |
|
12.3 |
20.86 |
Russia |
BIG-7 |
33 251 |
16.6 |
|
13.2 |
10.69 |
BIG-7 |
Russia |
33 144 |
12.2 |
|
34.3 |
3.27 |
Japan |
Japan |
6 574 |
41.3 |
|
-6.9 |
2.93 |
Belarus |
Belarus |
3 913 |
-5.3 |
|
4.3 |
1.54 |
China |
China |
3 169 |
11.0 |
|
-7.1 |
1.22 |
Korea |
Korea |
2 583 |
-2.7 |
|
-14.2 |
0.55 |
USA |
USA |
931 |
-16.3 |
|
-15.4 |
0.31 |
Other |
Other |
713 |
-22.5 |
|
10.6 |
41.37 |
Total |
Total |
84 278 |
13.3 |
Source: Russian Automotive Market Research
Used truck sales and market revenue,
by country of brand origin, %

Source: Russian Automotive Market Research
The Moscow region became the leader by used truck market capacity among Russian regions. Over the first two months of 2020 used trucks on 6.4 billion rubles were sold in the region. The leading three also included Moscow and Krasnodar region, in which 4.5 billion rubles and 3.8 billion rubles were spent on the purchase of used trucks, respectively.
Used truck sales and market revenue,
TOP-10 regions, January-February 2020
|
Dynamics, |
Sales, |
Region |
Region |
Market revenue, |
Dynamics, |
|
5.3 |
2.60 |
Moscow region |
Moscow region |
6 424 |
11.7 |
|
4.4 |
1.95 |
Krasnodar region |
Moscow |
4 470 |
3.1 |
|
100.3 |
1.58 |
Chelyabinsk region |
Krasnodar region |
3 821 |
0.3 |
|
-12.3 |
1.56 |
Moscow |
Tatarstan Republic |
3 540 |
26.0 |
|
11.1 |
1.50 |
Tatarstan Republic |
Chelyabinsk region |
3 330 |
119.4 |
|
21.9 |
1.20 |
Rostov-on-Don region |
Saint Petersburg |
3 117 |
7.0 |
|
4.7 |
1.18 |
Saint Petersburg |
Khanty-Mansi AR |
2 577 |
24.2 |
|
24.8 |
1.07 |
Bashkortostan Republic |
Rostov-on-Don region |
2 219 |
28.0 |
|
15.0 |
0.93 |
Irkutsk region |
Irkutsk region |
1 996 |
17.0 |
|
9.7 |
0.93 |
Khanty-Mansi AR |
Sverdlovsk region |
1 991 |
25.8 |
Source: Russian Automotive Market Research
______________
1 BIG-7: DAF, IVECO, MAN, MERCEDES-BENZ, RENAULT, SCANIA, VOLVO

