

15.01.2020 / 2019 results: trucks are in the red, buses - in the black
Download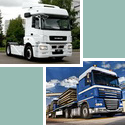
New truck market
In 2019 new truck sales amounted to 80.10 thousand units - by 1.7% less than in 2018.
The traditional market leader KAMAZ sold 28.64 thousand new trucks for the reporting period, which was a 6.2% rise year-on-year. GAZ, which took the second place, increased its new truck sales by 6.5% to 9.71 thousand units in 2019.
Against the background of growing sales of Russian trucks, the demand for vehicles of leading foreign brands fell.
For the reporting period the leading positions by new truck sales were taken by the Moscow region, Moscow and Tatarstan Republic. The largest growth in new truck sales among TOP-20 regions was shown by the Tyumen region (+63.3%).
New truck sales, ТОР-10 brands,
January-December 2019/2018, thousand units
|
Brand |
January-December 2018 |
January-December 2019 |
Change, % |
|
KAMAZ |
26.96 |
28.64 |
6.2 |
|
GAZ |
9.12 |
9.71 |
6.5 |
|
VOLVO |
6.38 |
5.69 |
-10.8 |
|
SCANIA |
6.69 |
5.63 |
-15.8 |
|
MAN |
5.07 |
5.02 |
-1.0 |
|
MERCEDES-BENZ |
4.84 |
4.06 |
-16.1 |
|
MAZ |
4.23 |
3.83 |
-9.5 |
|
URAL |
3.00 |
3.17 |
5.7 |
|
ISUZU |
3.27 |
2.61 |
-20.2 |
|
DAF |
2.80 |
2.58 |
-7.9 |
|
TOP-10 |
72.36 |
70.94 |
-2.0 |
|
Other |
9.16 |
9.16 |
0.0 |
|
Total |
81.52 |
80.10 |
-1.7 |
Source: Russian Automotive Market Research
New truck sales, ТОР-10 brands,
January-December 2019/2018, %
Source: Russian Automotive Market Research
New truck sales, ТОР-20 regions,
January-December 2019/2018, thousand units
|
Region |
January-December 2018 |
January-December 2019 |
Change, % |
|
Moscow region |
8.68 |
7.30 |
-15.9 |
|
Moscow |
6.85 |
6.58 |
-3.9 |
|
Tatarstan Republic |
4.91 |
4.65 |
-5.3 |
|
Khanty-Mansi AR |
3.58 |
4.10 |
14.5 |
|
Saint Petersburg |
3.54 |
3.34 |
-5.6 |
|
Nizhny Novgorod region |
2.88 |
2.84 |
-1.4 |
|
Krasnodar region |
2.21 |
2.13 |
-3.6 |
|
Chelyabinsk region |
3.03 |
1.99 |
-34.3 |
|
Smolensk region |
2.36 |
1.93 |
-18.2 |
|
Sverdlovsk region |
1.83 |
1.92 |
4.9 |
|
Irkutsk region |
1.81 |
1.84 |
1.7 |
|
Krasnoyarsk region |
1.66 |
1.70 |
2.4 |
|
Rostov-on-Don region |
1.81 |
1.70 |
-6.1 |
|
Bashkortostan Republic |
1.50 |
1.70 |
13.3 |
|
Samara region |
1.85 |
1.62 |
-12.4 |
|
Voronezh region |
1.39 |
1.38 |
-0.7 |
|
Yamalo-Nenets AR |
1.14 |
1.31 |
14.9 |
|
Tyumen region |
0.79 |
1.29 |
63.3 |
|
Perm region |
1.07 |
1.20 |
12.1 |
|
Orenburg region |
1.08 |
1.19 |
10.2 |
|
TOP-20 |
53.97 |
51.71 |
-4.2 |
|
Other |
27.55 |
28.39 |
3.0 |
|
Total |
81.52 |
80.10 |
-1.7 |
Source: Russian Automotive Market Research
N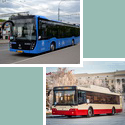 ew bus market
In 2019 the new bus market grew by 7.0% and amounted to 13.91 thousand units.
For the reporting period bus sales of the market leader Pavlovo bus plant amounted to 8.04 thousand units, which was a 6.9% rise year-on-year.
The leader by new bus among foreign brands in 2019 was the Chinese YUTONG, which sold 0.59 thousand buses – by 13.5% more than in 2018.
Moscow became the new bus market leader. Bus sales in 7 TOP-20 regions declined.
New bus sales, ТОР-10 brands,
January-December 2019/2018, thousand units
|
Brand |
January-December 2018 |
January-December 2019 |
Change, % |
|
PAZ |
7.52 |
8.04 |
6.9 |
|
LIAZ |
1.69 |
1.61 |
-4.7 |
|
NEFAZ |
0.77 |
1.09 |
41.6 |
|
YUTONG |
0.52 |
0.59 |
13.5 |
|
KAVZ |
0.38 |
0.42 |
10.5 |
|
VOLGABUS |
0.58 |
0.40 |
-31.0 |
|
MAZ |
0.57 |
0.38 |
-33.3 |
|
HIGER |
0.22 |
0.26 |
18.2 |
|
KAMAZ |
0.03 |
0.16 |
433.3 |
|
SIMAZ |
0.02 |
0.14 |
600.0 |
|
ТОР-10 |
12.30 |
13.09 |
6.4 |
|
Other |
0.70 |
0.82 |
17.1 |
|
Total |
13.00 |
13.91 |
7.0 |
Source: Russian Automotive Market Research
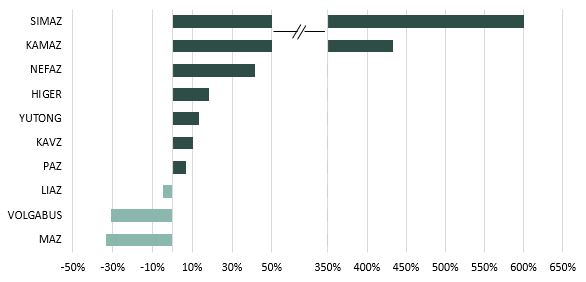
New bus sales, ТОР-10 brands,
January-December 2019/2018, %
Source: Russian Automotive Market Research
New bus sales, ТОР-20 regions,
January-December 2019/2018, thousand units
|
Region |
January-December 2018 |
January-December 2019 |
Change, % |
|
Moscow |
1.15 |
2.05 |
78.3 |
|
Krasnodar region |
0.53 |
0.78 |
47.2 |
|
Saint Petersburg |
0.53 |
0.64 |
20.8 |
|
Bashkortostan Republic |
0.29 |
0.56 |
93.1 |
|
Moscow region |
1.24 |
0.55 |
-55.6 |
|
Nizhny Novgorod region |
0.59 |
0.46 |
-22.0 |
|
Kemerovo region |
0.38 |
0.41 |
7.9 |
|
Tomsk region |
0.12 |
0.40 |
233.3 |
|
Rostov-on-Don region |
0.69 |
0.37 |
-46.4 |
|
Lipetsk region |
0.12 |
0.32 |
166.7 |
|
Sverdlovsk region |
0.55 |
0.27 |
-50.9 |
|
Krasnoyarsk region |
0.33 |
0.25 |
-24.2 |
|
Tyumen region |
0.37 |
0.25 |
-32.4 |
|
Perm region |
0.19 |
0.25 |
31.6 |
|
Primorsky region |
0.15 |
0.25 |
66.7 |
|
Tatarstan Republic |
0.43 |
0.25 |
-41.9 |
|
Chuvash Republic |
0.15 |
0.24 |
60.0 |
|
Khanty-Mansi AR |
0.20 |
0.21 |
5.0 |
|
Irkutsk region |
0.15 |
0.20 |
33.3 |
|
Ryazan region |
0.12 |
0.20 |
66.7 |
|
TOP-20 |
8.28 |
8.91 |
7.6 |
|
Other |
4.72 |
5.00 |
5.9 |
|
Total |
13.,00 |
13.91 |
7.0 |
Source: Russian Automotive Market Research
Press-release archive

Information
Market analysis
 Spare parts market analysis
 Automotive statistics
 Automotive leasing
 IT-solutions for automotive market analysis
 Taxi population in Russia
 Dealers
 Financial capacity of the automotive market
 Corporate vehicle market
 Total cost of ownership
 Special purpose vehicle
 Legal factors affecting automotive market formation
 Vehicle prices
 Residual value of cars and special purpose vehicles
 Forecasts
